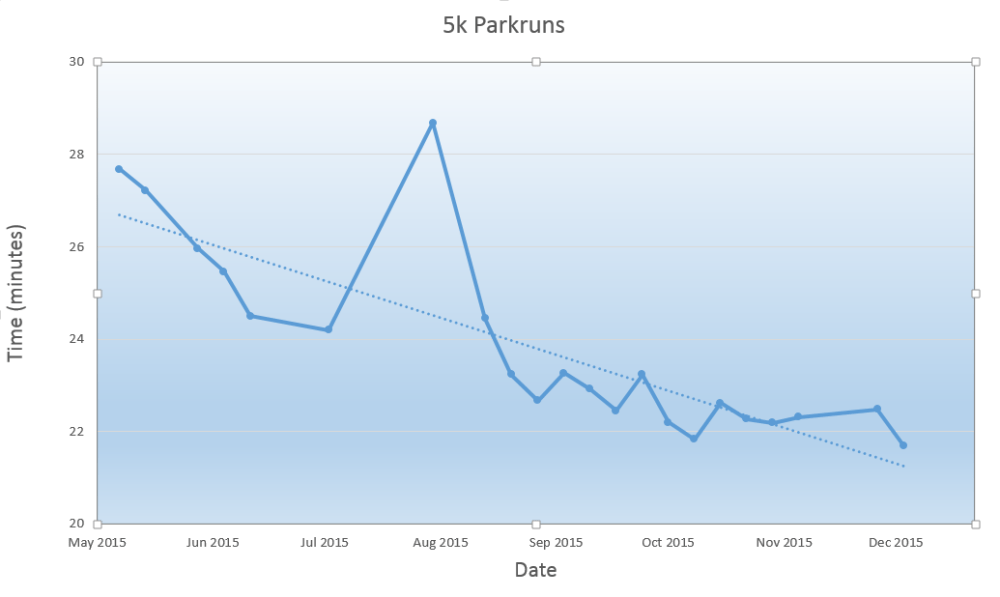
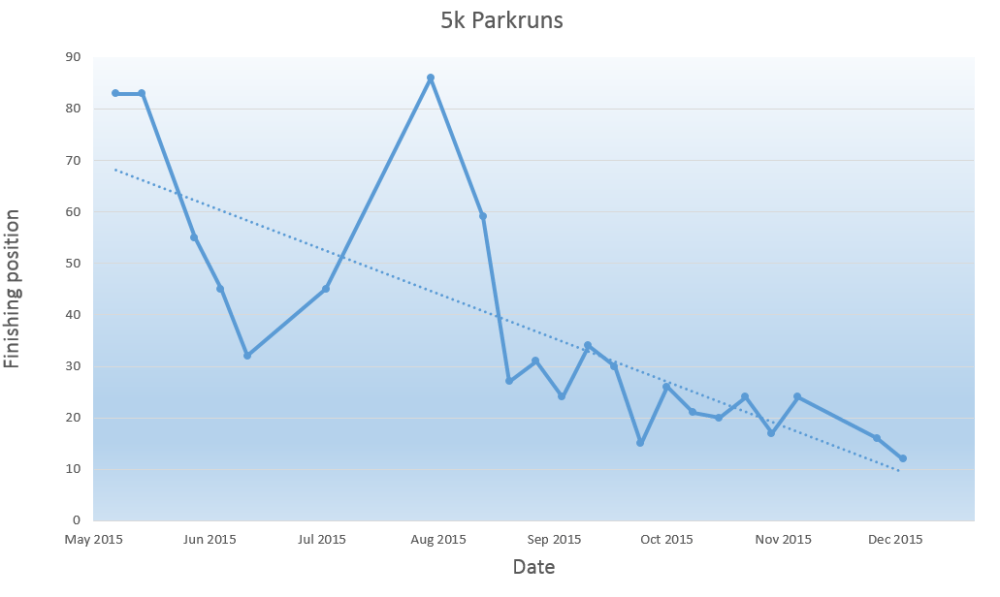
I wasn’t sure where to start with my first blog post. It was tempting to go in chronological order but if I started with my history of running, stopping and running again I might never get up to date. So for the first post I decided to jump right in at the present (December 2015) then go back and fill in the blanks later. Years ago I read a quote something like “anything which gets measured and analysed, improves”. As I had been doing regular weekly parkruns, I had collected a list of times achieved over the standard 5k parkrun distance which I could analyse in graphical format, and then use to set future targets. So that is what I did. The first graph below shows the improvement in my times over the course of 22 parkruns so far, from over 28 minutes to under 22 minutes, and the second graph shows the improvement in my finishing position from in the 80s to a recent 12th place. I can now easily record and review progress on a weekly basis and the trends in the graphs give me a lot of confidence for making further improvements in the months to come.
(The high point in August 2015 was recorded when I had a sore hamstring after attempting to run too fast in a training session. Luckily I was still able to continue with daily running, just more slowly than normal until the issue cleared up.)